
Understanding Maps
Map : A map represents the earth’s surface or a part of it on a flat surface with the help of a scale.
Globe : It is a small size model showing the shape of the earth. A globe is useful as follows :
(i) It can rotate freely on its axis.
(ii) A globe shows accurate sizes and shapes of continents, oceans and major features of the earth.
(iii) Lines of latitude and longitude are drawn on the globe. They help in locating different destinations.
(iv) Distances and directions between places are shown on the globe.
Maps of large areas are not as accurate as a globe : Maps are drawn on flat surface. It is impossible to flatten a sphere completely. As a result, the shape and size of continents and oceans become distorted.
Advantage of a sketch : The sketch has relevant details and not all features as in a map. It is drawn quickly from one’s memory, without a scale.
Advantages and disadvantages of globe : A globe is a small sized model of the earth.
Advantages :
(i) It is the most suitable way of showing the earth as a whole.
(ii) The globe can be mounted on an axis and can be rotated freely.
(iii) On the globe lines of latitude and longitude are also shown.
(iv) The earth can be represented accurately with the help of a globe.
(v) A globe shows, relative sizes and shapes of continents, oceans and other features.
(vi) A globe shows distance and directions between places.
Disadvantages :
(i) Space on a globe is small to show all important features of a continent.
(ii) It is very difficult to handle.
(iii) Details such as villages and towns, roads, railways, etc. can not be shown on globes.
Small scale maps : This type of maps show large areas on a small size of paper. Maps of continents and countries included in an Atlas are examples of small scale maps.
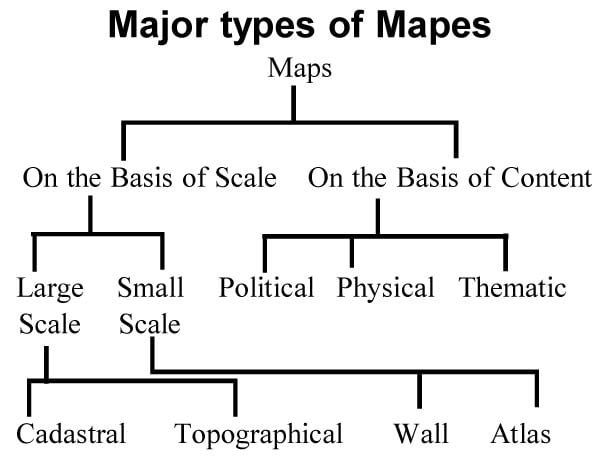
Wall maps : Wall maps are small scale maps used for display. They show large areas of the earth at a glance. They may show different features like relief, temperature, vegetation, population and communication.
Atlas maps : Maps used in Atlas are called Atlas maps. These are drawn on small scale. In these maps, a distance of one centimetre on the map corresponds many kilometre on the ground. Atlas maps show only a few details.
Political maps : Political maps are used to show the countries of the world. They exhibit parts of countries like states, borders between countries and important towns and cities. These are small scale maps.
Physical maps : Physical maps are also small scale maps. They represent natural features of an area of the earth.
Thematic maps : Maps that show particular features are known as thematic maps. These maps represent the natural vegetation of an area or the distribution of minerals or industries.
Large scale maps : These maps represent small areas on a large sized paper. Survey of India topographic map on a scale of 1 : 50,000 is an example of large scale map.
Topographical maps : On these maps one centimetre shows only a few hundred metres. Topographical maps are made on the basis of field survey. In these maps new extensions of towns, new roads or buildings can be added on the basis of field survey.
Cadastral maps : These are large scale maps and give full details of properties and buildings. These maps are useful for city surveys and estate management.
Advantages of large scale maps : Large number of details are not shown by small scale maps. A map of a local area is prepared on a large scale for showing greater details than those on maps of continents and countreis. They show more details because in these maps one centimetre represents five meters.
Relief features on small scale maps : In these maps lands of different heights are shown by shades of different colours. Colours are chosen as per convention adopted uniformly for such physical maps. Plains and low-lands are shown by shades of green. Uplands by yellow. Higher elevations by shades of brown. The shades of brown become darker as altitude increases. Snow covered mountains are shown in white or light blue.
Scale of the map : A scale is a ratio of distance between any two points on a map to the corresponding distance between the same two points on the actual land.
Different ways of representing Scale on the Map
(a) By a Statement : In this the scale is stated in words such as 1 cm. to 7 km or 1 inch to 25 miles. This shows that 1 cm on a map corresponds to 7 km on the ground.
(b) By Representative Fraction or R.F. : In this method, the numerator is always one and shows the map distance. The denominator shows the corresponding ground distance. Representative fraction
In this R.F.1 : 100,000 or 1/1,00,000 means that one unit covered on the map represents 1,00,000 units covered on the ground.
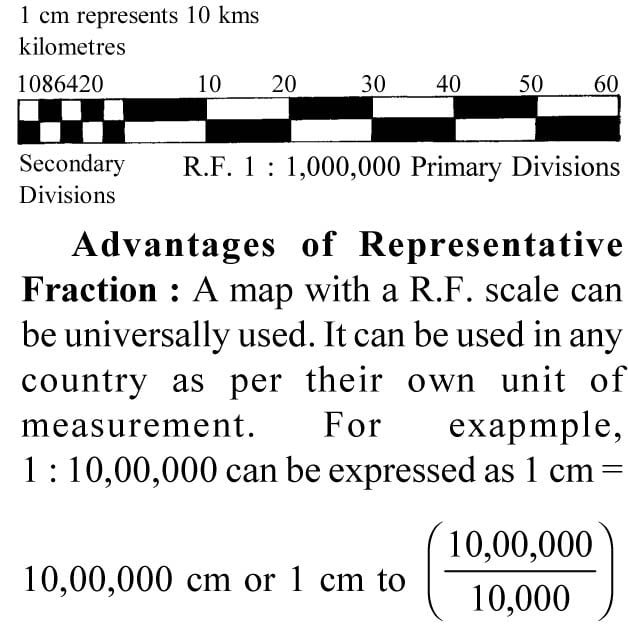
(c) By Graphic Scale or Linear Scale : In this map a straight line is drawn at the foot of a map. It is divided into primary and secondary equal parts. The distance on the map can be directly measured and read off by using a piece of string or dividers.
Ways of Measuring distance on the Maps
(a) To measure Straight Distances : To measure distances on the map, a pair of dividers, a ruler and a strip of paper is used. Distance read by dividers or paper strip can be placed on linear scale. Suppose two places on a map are 8.5 cm apart. The scale used is 1 cm = 2 km. Then 8.5 cm = ½ × 8.5 = 4.25 km.
(b) To measure Indirect Distances : On a curved line, a hard thread is used to measure distance and to follow the course of a winding road or river. Then this thread is measured against the linear scale.
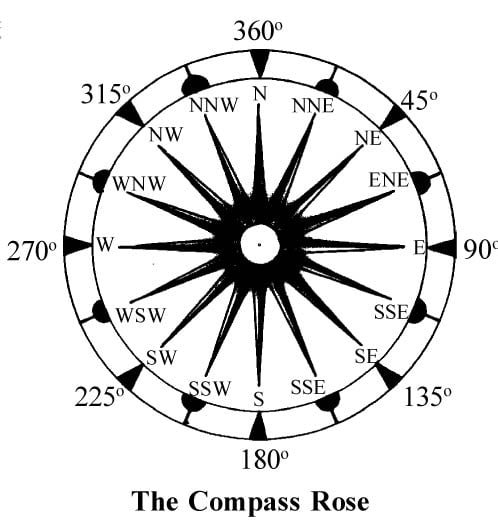
Direction and cardinal points : Direction on a map is the way that helps us to find a way specially in oceans. The direction of a place is always expressed in relation to a given point. Four main directions—North, South, East and West are known as cardinal directions. Mid-points between any of these two directions are given a common name. A magnetic compass is used to find direction.
Advantages of Representative Fraction : A map with a R.F. scale can be universally used. It can be used in any country as per their own unit ofmeasurement. For exapmple,
Types of North are :
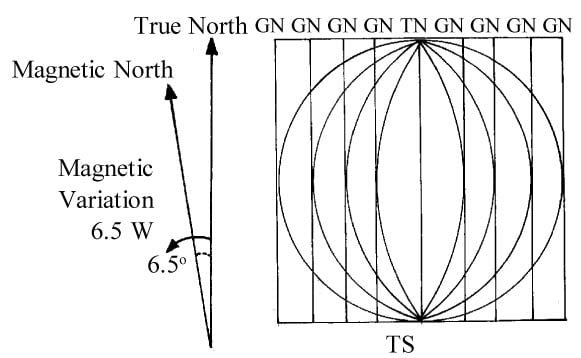
(a) True North or Geographic North : The position of the Pole Star is known as true north. On a globe, all the meridians in the Northern Hemisphere converge on the geographic north pole or the true north.
(b) Magnetic North : The direction of north shown by the magnetic compass is known as the magnetic north.
(c) Grid North : Earth is spherical but all maps are made on a flat surface in which meridians are taken to be straight and are named as grid north.
Magnetic declination or magnetic variation : The angular separation between true north and magnetic north is called as magnetic declination or magnetic variation.
Bearing : The clockwise measure of the angle formed between the north line and the line joining the two given points is called bearing. For example, bearing between points X and Y will be measured as given below in the figure :
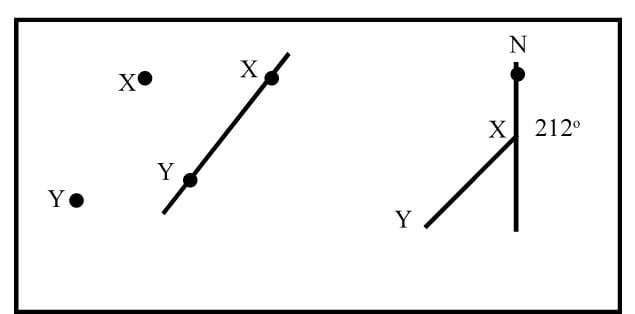
This is Grid Bearing since is it has been measured from grid north.
Backward bearing : The bearing from the observer’s position to a given object is called forward bearing (FB) but bearing from the given object to observer’s position is the backward bearing (BB) as shown below.
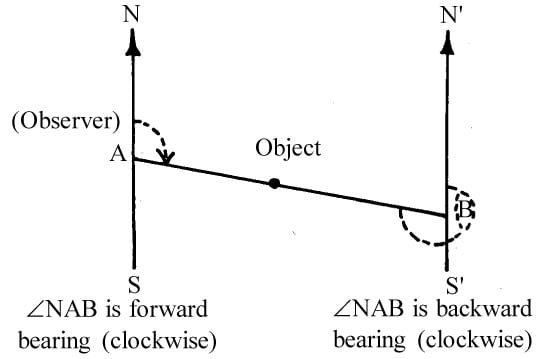
There is a relationship between FB and BB. If FB is less than 1800, we have to add 1800 to it to get BB. If FB is more than 1800, we have to subtract 1800 from it to get BB.
Topographical Maps
Accurate surveys provide large scale maps. In these maps elevations are shown by contour lines and natural features are shown by colours. These maps represent the minutest detail of an area.
Contours
A contour is an imaginary line, joining the points at the same height above sea level. Landforms are shown through contours. It is a very accurate, common and popular method. They show height above sea level and also the slope of the land. Closely spaced contours on a map show a steep slope. Gentle slopes are shown by widely spaced contour lines. For slopes being vertical, contour lines touch each other. The pattern of contours gives an idea about the shape or form of various relief features on earth’s surface.
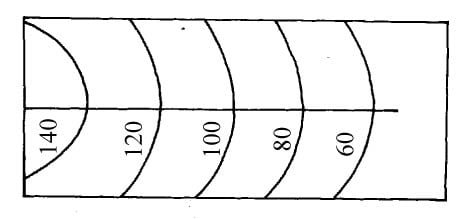
Example :
Contour Interval : Contour interval is the difference between two consecutive contour lines. In the following example, C.I. is 40 metres.
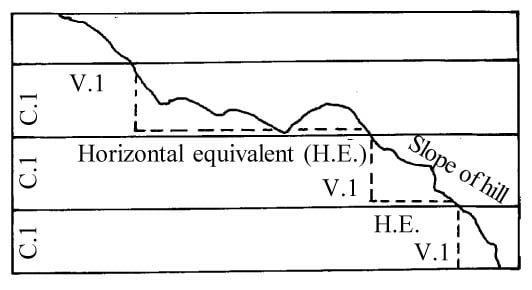
Vertical Interval : It is the vertical distance between any two contours.
Horizontal Equivalent : H.E. is the horizontal distance between two points.
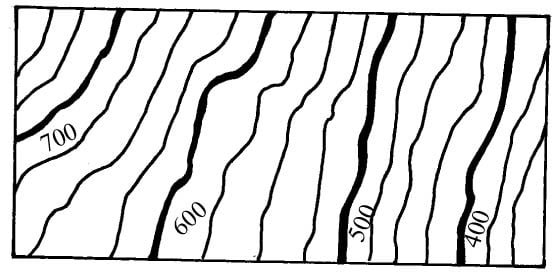
Index Contours : When a large number of contours make the reading of toposheets difficult, contour lines at certain regular interval are thickened to make the map easier to read. These thickened contour lines are known as index contours.
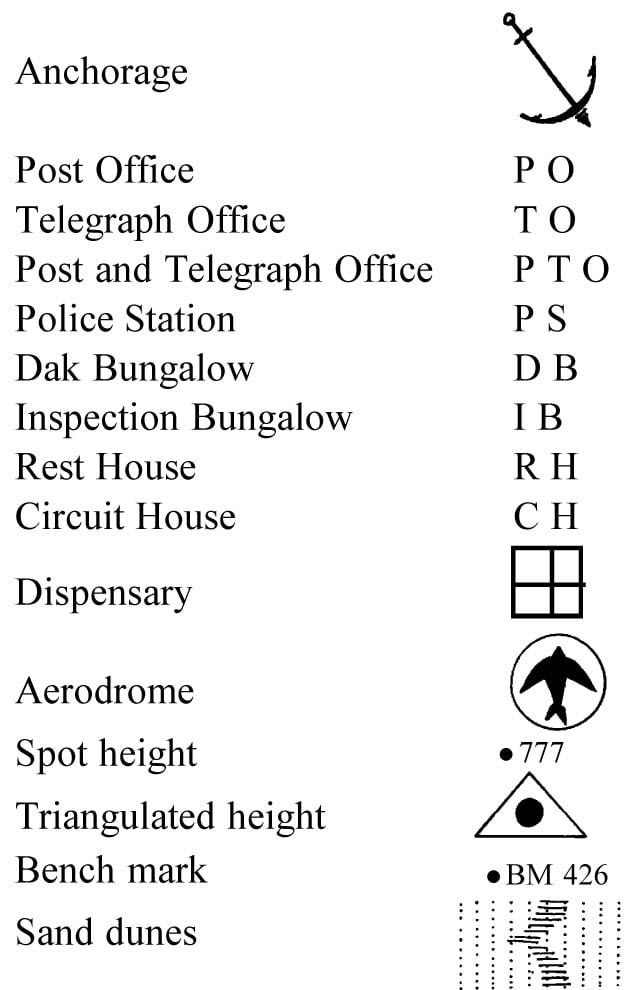
Spot Heights : Spot heights are the actual heights above mean sea level. On toposheets, these are shown as dots followed by number, e.g., 712 giving height of point in mt.
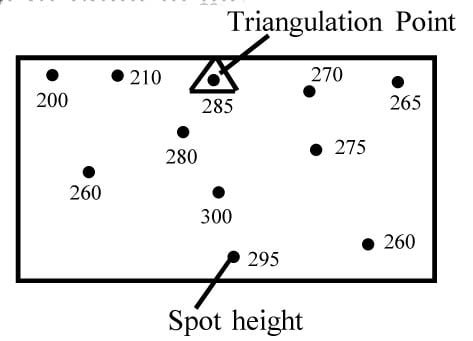
Triangulation Points : These are heights above sea level determined by trigonometric survey. These heights are represented on a map with dots enclosed inside the triangles, e.g. . This figure means this point has a height of 285 metres above mean sea level.
Bench Marks : Bench marks are marks placed on buildings, towers, etc. above sea level. On maps, these are indicated by the letters BM followed by a number giving the height of the point in feet or metres. For example, BM 600 m.
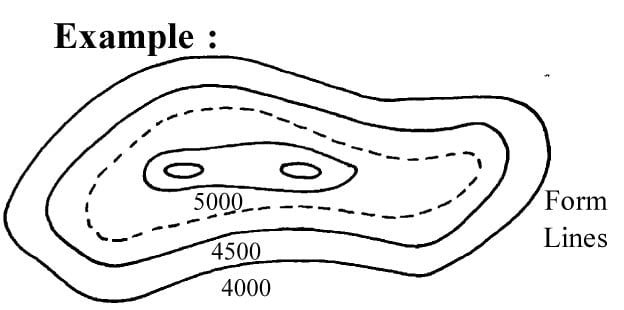
Form Lines : These are the contours interpolated by eye sketching in between the instrumentally fixed contours. These are indicated by broken lines. They are useful in showing small details of the topography which are not easily represented by contours in an area of low relief and with large contour interval.
Example :
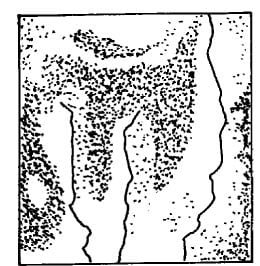
Hachures : Hachures are small disconnected lines drawn down the slopes. In areas of steep slopes, the hachures are thick and close. Where the slope is gentle, they are very thin and apart. Flat area is left unshaded. Hachuring does not show absolute height but it represents the general configuration of the land.
Hill Shading :
(i) Vertical Illumination : Vertical illumination is the light held vertically above the country used for illumination which varies according to the steepness of the slope. The steeper the slope, the shading is more darker. Most of the mild slopes like hills, slopes, plateaus and valley bottoms, etc., have lighter shade.
(ii) Oblique Illumination : In this, the source of light is used for oblique illumination and supposed to be beyond the north-west corner of the map. Thus, slopes which face to the north-west will be light, while south-east facing slopes will be dark. This is a deceptive method and does not represent any idea about the relative steepness of the slopes.
Hill shading technique does not give any idea about heights and gradients.
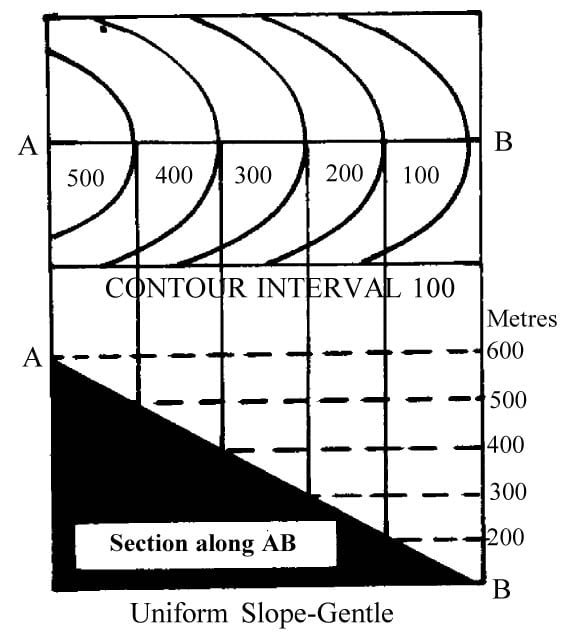
(a) Uniform Slope : In uniform slope the angle of the slope is same throughout.
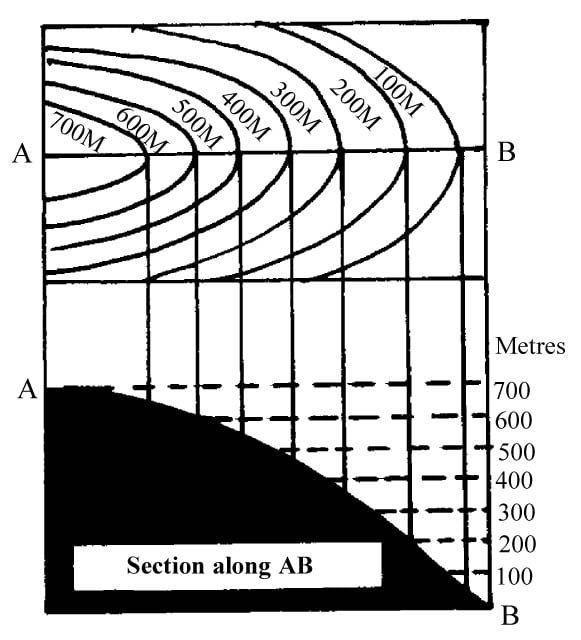
(b) Convex Slope : In convex slope surface of the land bulges outward. Such a slope is steep in the lower part and fairly gentle in the upper parts.
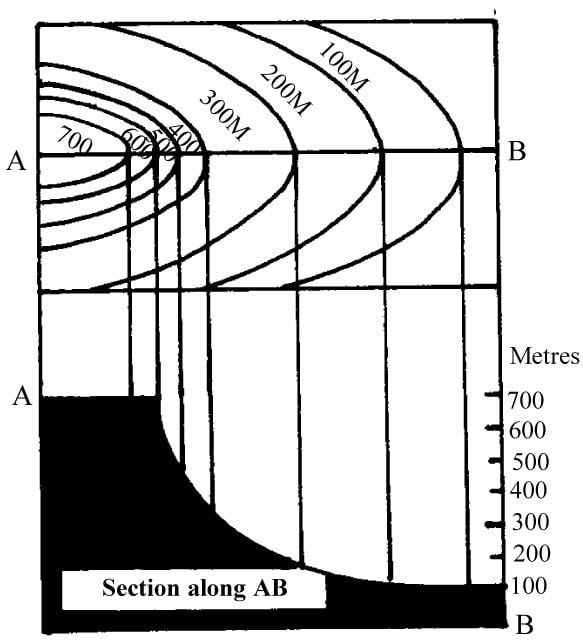
(c) Concave Slope : In concave slope the surface goes inward. Such a slope is gentle in the lower part but it is steep in the upper parts. Contours are widely spaced on the lower slope.
(d) Terraced Slope : In terraced slopes when the surface has steps, the contour lines representing such a slope are alternatively close together and far apart.
(e) Scarp and Dip Slopes : In this type of slopes one slope is steep (scarp) and another side has gentle (dip) slope. The contour lines in an escarpment are closer towards the scarp slope and further apart towards the dip slope.

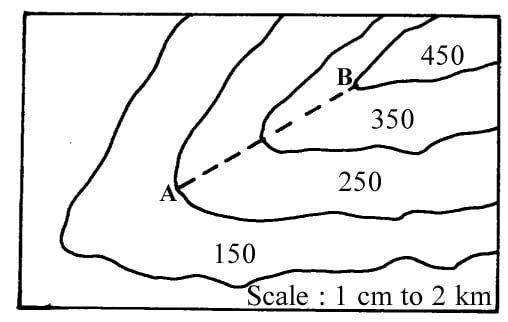
Gradient : It is the amount of vertical rise of land with respect to horizontal level. It refers to the rising or descending by regular degrees of inclination. In the diagram below, we can find out the gradient between A and B.
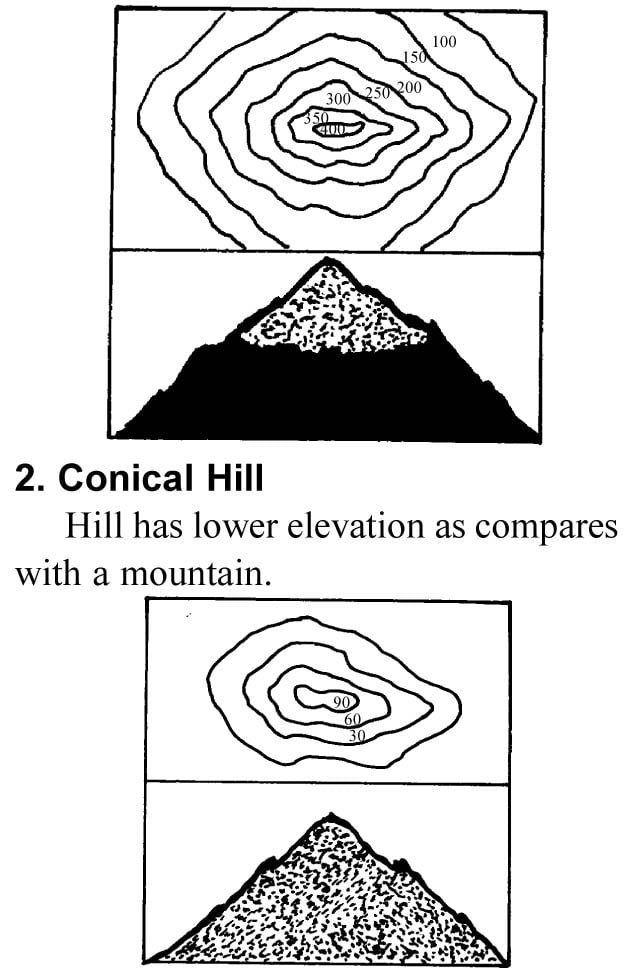
1. Mountain
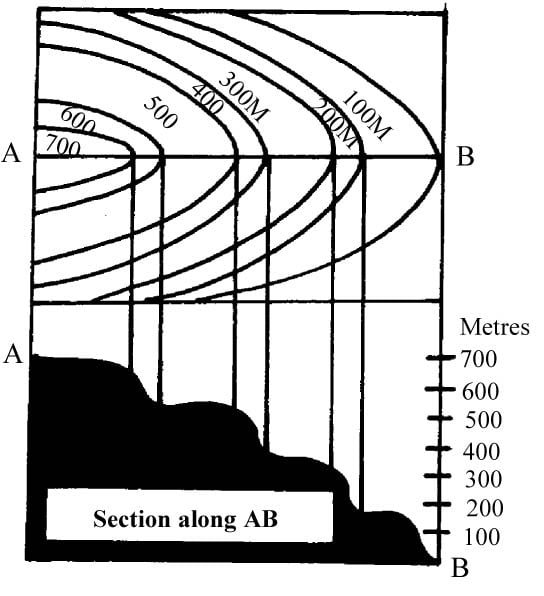
A mountain is a natural elevation on the earth rising abruptly from the surrounding area on a map the contour spacing provides the type of a mountain.
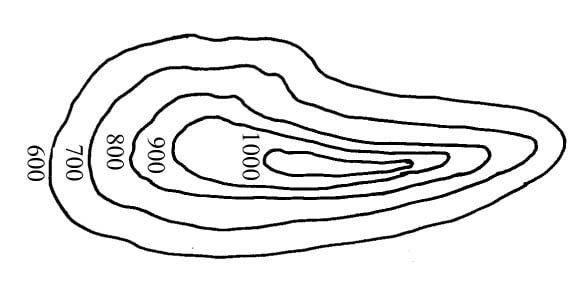
1. Plateau (Tableland)
A plateau is a broad and vast land going up abruptly from the surrounding area.
On the map a plateau is represented by closely spaced contour lines on the lower slopes while there are hardly any contour lines on the upper slopes. This shows steep sides and a flat surface at the top.
Dissected plateau : A plateau cut up by a number of valleys of rivers and streams, is called a dissected plateau (e.g., the Deccan Plateau of India).
2. Ridge
It is a long and narrow hill or mountain, having many summits. It resembles the spine of a book.
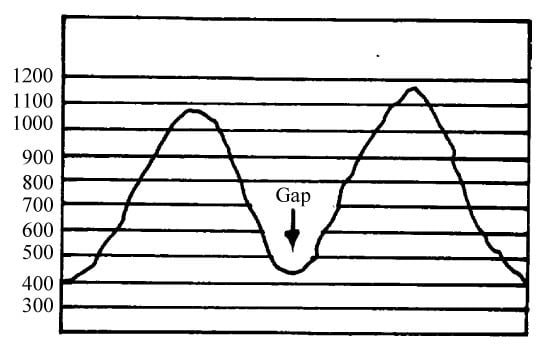
Col, Gap and Saddle
Col or Pass : If the gap between two peaks of a ridge is located fairly high up, it is called a col or pass.
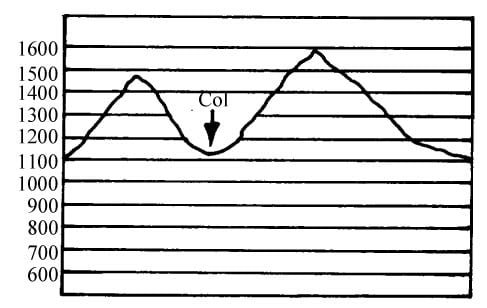
A pass is a small gap through a mountain barrier. It is usually caused by erosion, either by glaciers or by two streams which rise close to each other on opposite sides of a mountain barrier.
On a map, a pass is shown by a dip in the height of the watershed.
3. Gap : A gap between two summits on a ridge is located closer to the valley floor, it is called a gap. It provides a route to the people. A gap is also called a pass that is lowered down by the action of running water.
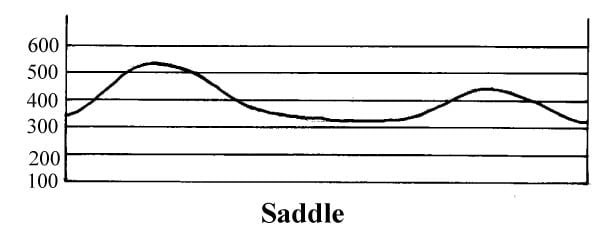
4. Saddle : It is a depression between two peaks. It has gentle slopes and looks like a riding saddle. Saddles are slightly lower than the peaks they separate, and are not usually used as routes across mountains. It is a broad pass between two mountain peaks.
5. Watershed
It is an imaginary line following the crest of ridges which divides all the streams flowing into one river from flowing into the next.
On a map a watershed is shown by a dotted line joining the highest points on the ridge (crest).
6. Valley
It is a long depression between two mountains. On the map the contour lines are ‘V’ or ‘U’ shaped, the apex of which points to higher ground.
(a) V-shaped river valley : In the upper course of rivers in mountains V-shaped valleys are found. As the gradient steep, the river flows eroding the bed of the river, and widening its bank a little, resulting in a ‘V’ shaped valley.
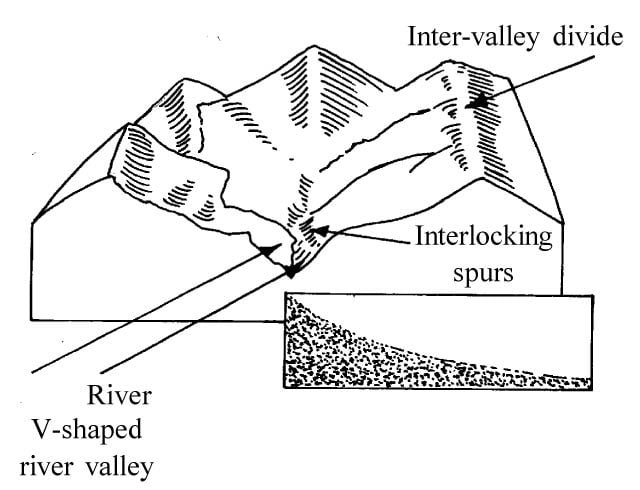
Close spacing is used to show it on a map. Indicating the steepness of sides. The apex of the ‘V’ points to higher gorund, i.e., towards its source, and the river itself flows through the bends of the contour.
(b) Gorge or Canyon : These are also called as ‘I’-shaped valleys. They are found in the upper course of rivers in the mountains where the rocks are hard and resistant to the action of water.
The energy of the river is utilised for down-cutting action, resulting in a narrow valley with almost vertical sides.
A gorge is shown on a map by crowded spacing of the contour lines.
(c) ‘U’ shaped valley : The middle course of a river gives birth to a U-shaped valley.
1. ‘U’-shaped river valley : As the middle course the river flows slowly, widening its banks a U-shaped valley is created. Such a valley has steep sides and a wide bed.
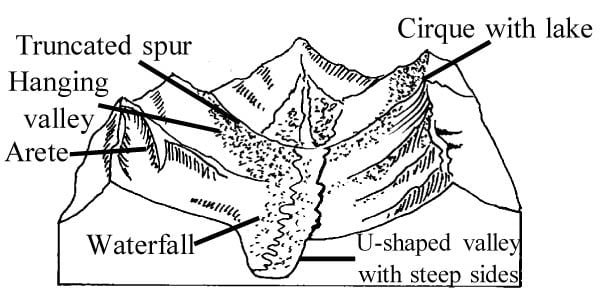
2. Glaciated U-shaped valley : As the glacier moves down the pre-existing river valley, it erodes the bed, widening the floor and creates a U-shaped valley.
On the map, the contour lines are crowded along the sides and widely spaced at the bottom.
(d) Hanging valley : Hanging valleys are associated with glaciated ‘U’-shaped valleys. They are formed where the tributary valley meets the main glacier. Usually the main glacier erodes an deeper ‘U’-shaped valley than its tributary. Therefore, the tributary valley is higher than the floor of the main valley and is seen as a hanging valley.
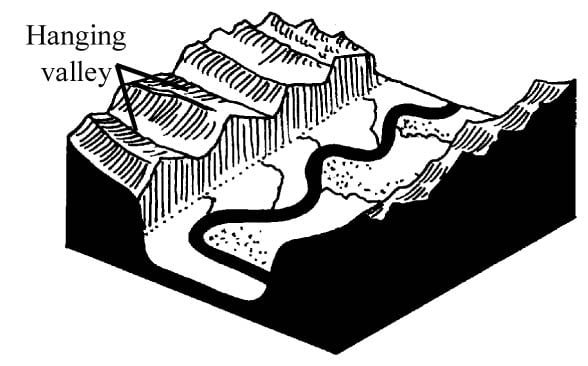
On the map, a hanging valley can be shown as ‘hanging’ amidst ‘U’-shaped contour lines, the steep sides occupied by somewhat semi-circular contour lines.
(e) Cirque (or Corrie) : The circular depression near mountain peaks from where glaciers born out are called corrie. In depression snow accumulates. Due to its own weight, the snow is changed into ice. The ice cuts downwards into the walls of the mountain, by which the sides are made steep.
On the map, the contours are spaced closer together at the back and in the front indicating a steep slope, and far apart in the cirque.
7. Spur
Spur is a type of finger of highland projecting into low ground. Spurs isolate one valley from another.
A spur is shown by ‘V’ shaped contour lines on a map.
Note : On the map both valleys and spurs are shown by ‘V’ shaped contour lines. The main difference between them is seen in the way the lines are numbered and the direction in which the apex points.
(a) In a valley the value of the contours is in increasing order and the apex of the V points to the higher ground.
(b) In a spur, the value of the contours is in decreasing order and the apex of the V points to the lower ground.
Interlocking spur : These are formed in well developed valleys, where steep spurs descend alternately from either side.
8. Cliff
The steep face of rock (almost vertical drop), with considerable height, found along the side of mountains, plateaus and along highland bordering coasts is called a cliff.
Contour lines indicating these the steep side of a cliff run very close to one another, often merge together.
9. Waterfall
When sudden and vertical fall of water over a steep rocky edge into the bed of a river takes place it is called a waterfall.
The contours are shown close together and may merge into one another. It may be noted that the contours on either side of the river show the same height.
On a map, a waterfall can be shown when contours merge into one while crossing a river stream.
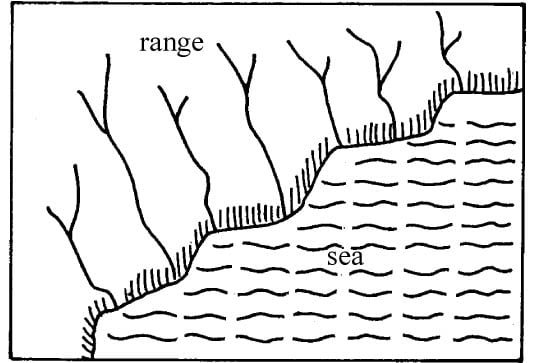
Types of Drainage Pattern
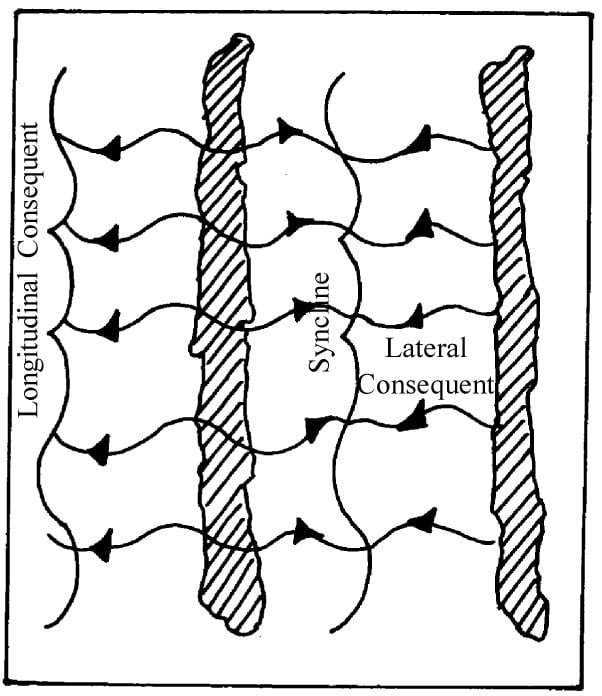
(a) Trellised pattern : These patterns are developed in the area of simple folds having parallel anticlinal ridges alternated by parallel synclinal valleys. In such regions, the main river is able to cut across resistant ridges, while the tributaries cut into soft rock.
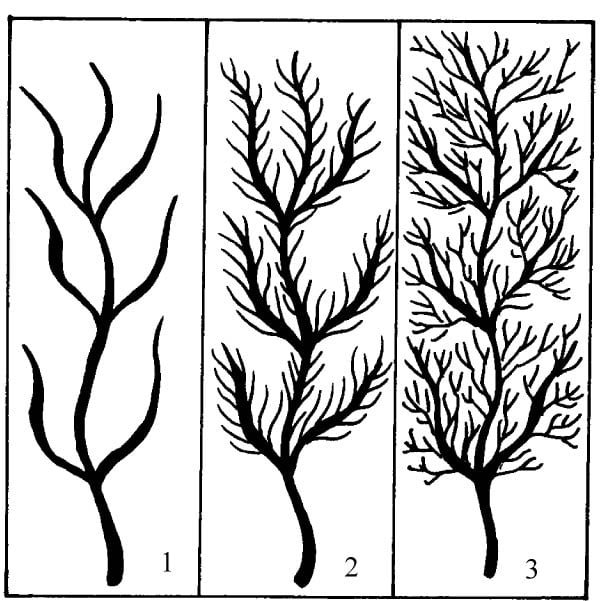
(b) Dendritic pattern : These are tree-shaped drainage pattern. They are most widespread pattern on the earth. Such patterns develop on surface having almost flat or low reliefs. Areas of homogeneous lithologies develop dendritic pattern. In this pattern, tributaries join the main river at acute angles to form the pattern similar to the tree and its branches.
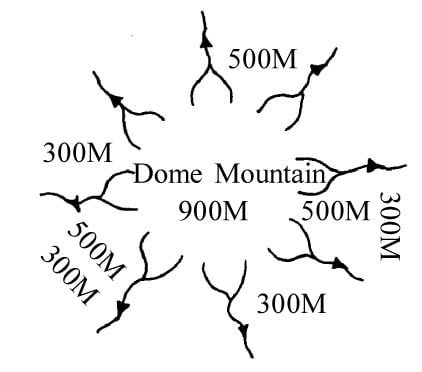
(c) Radial pattern : This pattern is made by the streams which tend to flow away from a central higher point, e.g., dome or volcano in all directions like the spokes of a wheel or centrifugal pattern.
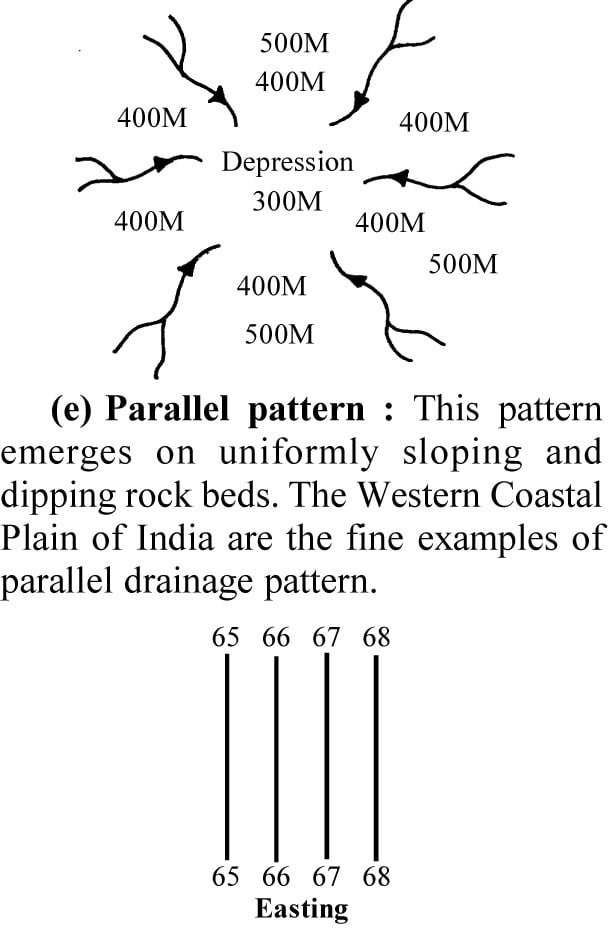
(d) Centripetal pattern : In this pattern, streams converge at a point which is generally a basin or depression. The Kathmandu valley of Nepal presents an ideal example of centripetal drainage.

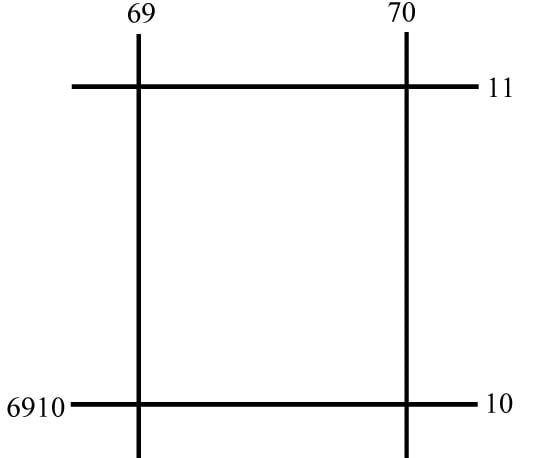
National Grid Reference
These are imaginary lines drawn on toposheets with red colour. These lines run from north to south called eastings and east to west called northings. The origin of the grid reference lies at a point in the south-west corner of the map. Grid references help in locating any place by stating its distance east or north of the origin of the grid reference.
Four figure grid reference : In four figure grid reference, the first two figures are eastward and the last two figures are northward. The crossing point of eastings and northings in the south-west is considered the origination point. For example, By four figure grid reference method, we can locate area of 1000 × 1000 metres on new toposheets and 1000 × 1000 yards on old toposheets.
Prominent Colours used to show different Features on Toposheets
(a) Black : Black ink is used for marking Names, lines of latitude and longitude, river banks, dry rivers, broken grounds, surveyed trees, heights and their numbering, railway, mines, telephone and telegraph lines etc.
(b) Blue : Blue colour is used for bodies having water.
(c) Green : Forests, orchards, scrubs and scattered trees are shown by green colour.
(d) Yellow : Cultivated areas are shown by yellow colour.
(e) Brown : Contour lines, their numbering, form lines and all sand features like sand dunes, sand hills, stony waste are indicated by brown colour.
(f) Red : Grid lines, their numbering, roads, cart tracks, settlements, huts and other buildings are shown by red colour.
(g) White patches : Uncultivated and barren lands are marked with white patches.
Inferences for Highland Areas :
(a) Most of the slopes are not suitable for agriculture. Pastures on the slopes may be fit for grazing.
(b) In high land areas forestry may be a predominant economic activity in this region.
(c) Flat area over plateaus are used for cultivation.
Judgement of the Suitability of Land for Agriculture from Toposheets
(a) A meandering river on the toposheet will indicate lower or nil gradient. Hence such a plain and land area would be suitable for agriculture.
(b) A tree shaped pattern would confirm soft surface suitable for agriculture.
(c) Sand features, e.g., barkhans and disappearing stream would indicate, dry conditions with high temperature. These conditions are unsuitable for agriculture.
(d) Presence of broken ground indicates seasonal flooding. Silt deposition by rivers is a good sign for agriculture.
(e) The number of canals, dams, tanks, and tubewells will show the intensive use of land for agriculture.
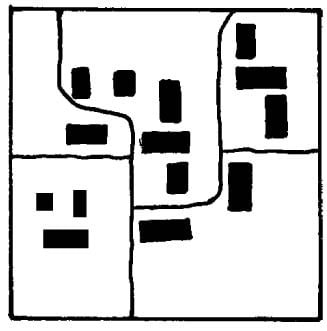
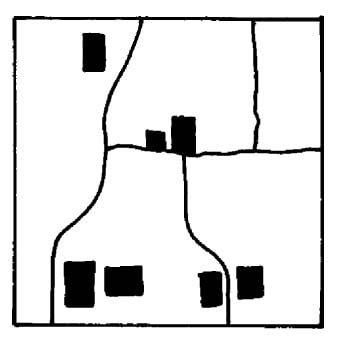
Settlement
It is a cluster of inhabited houses, may be rural or urban tells about settlement. A settlement perform a large number of functions including economic activities. The settlements are of five kinds—
(a) Nucleated or Clustered pattern : In nucleated settlements the houses are very close to each other and are constructed in a compact manner. In new cities houses are arranged in a regular or geometrical patterns, whereas in older towns dwellings are arranged in an irregular pattern.
(b) Dispersed or Scattered settlements : These are found in the areas of sparse population sheltered valleys or at foot hills. Here buildings are far away from each other. They are almost isolated.
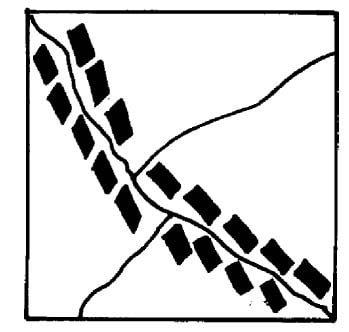
(c) Linear or Ribboned pattern :In this buildings are constructed along the road, canal, river or railway line. This type of pattern is known as linear pattern.
(d) Radial pattern : In this houses spread out from a central point. There is a water body, temple, palace or a road junction.
(e) Rectangular pattern : In this pattern houses are built where two or more main roads cross each other.
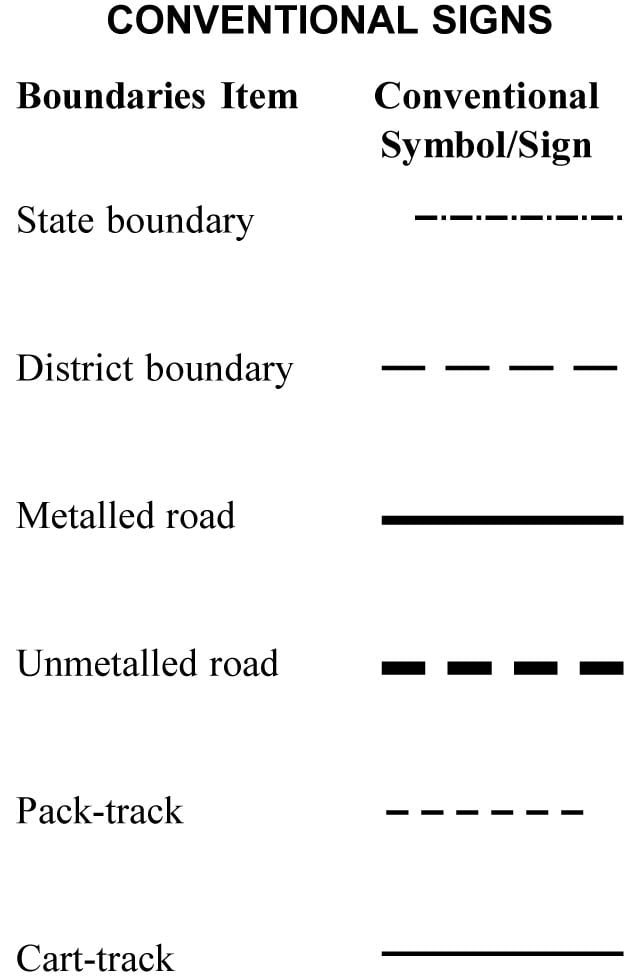
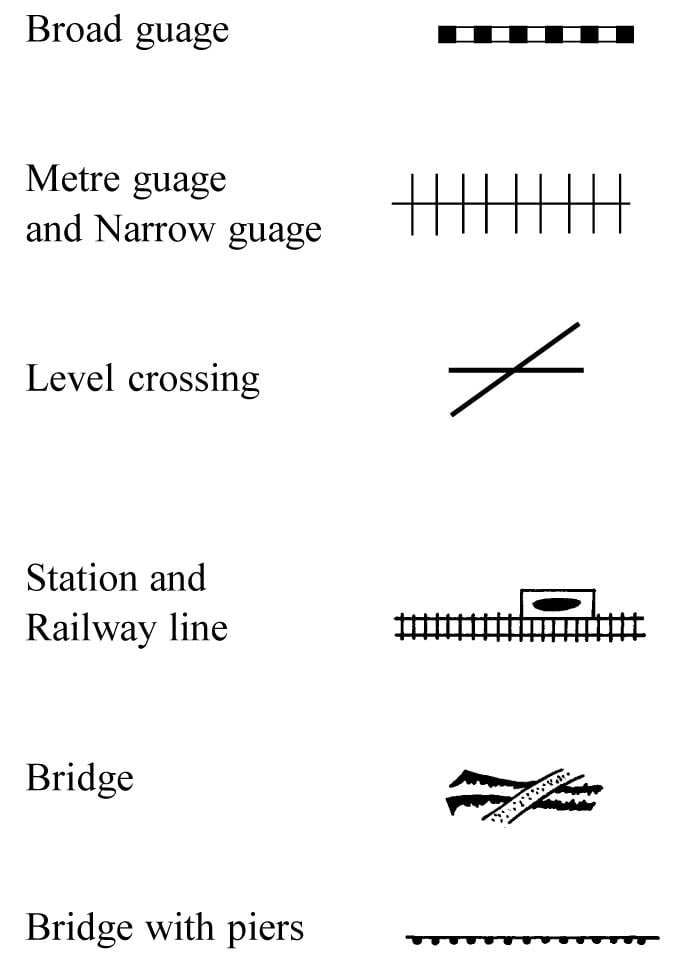
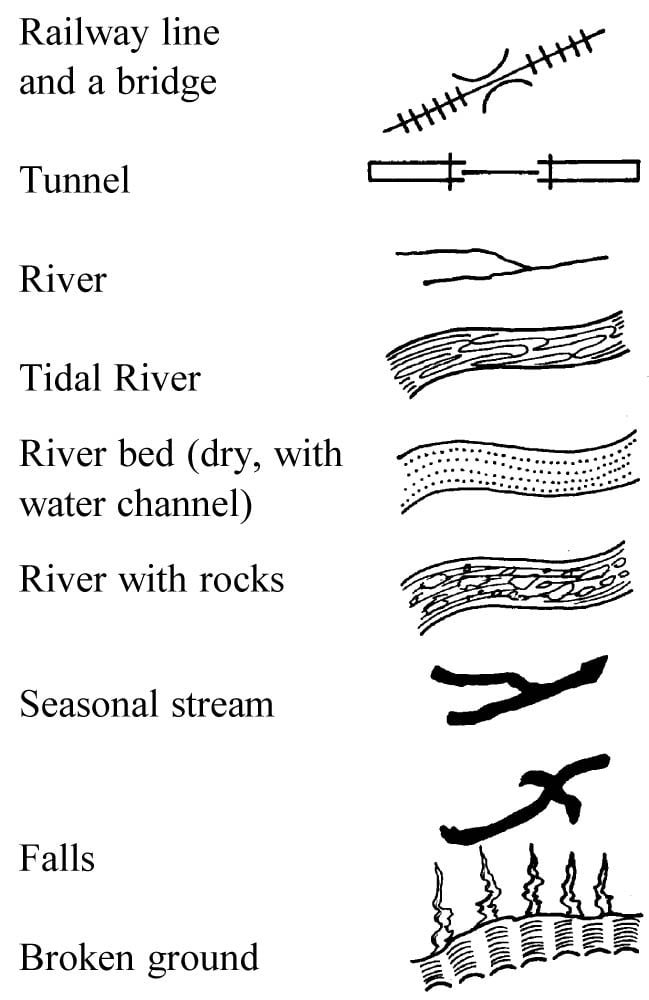
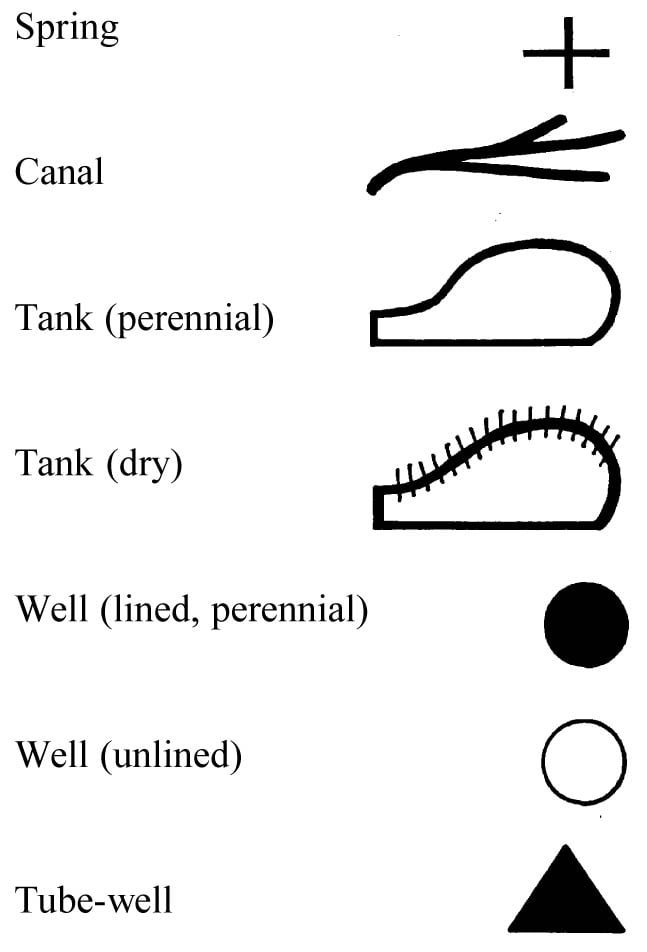
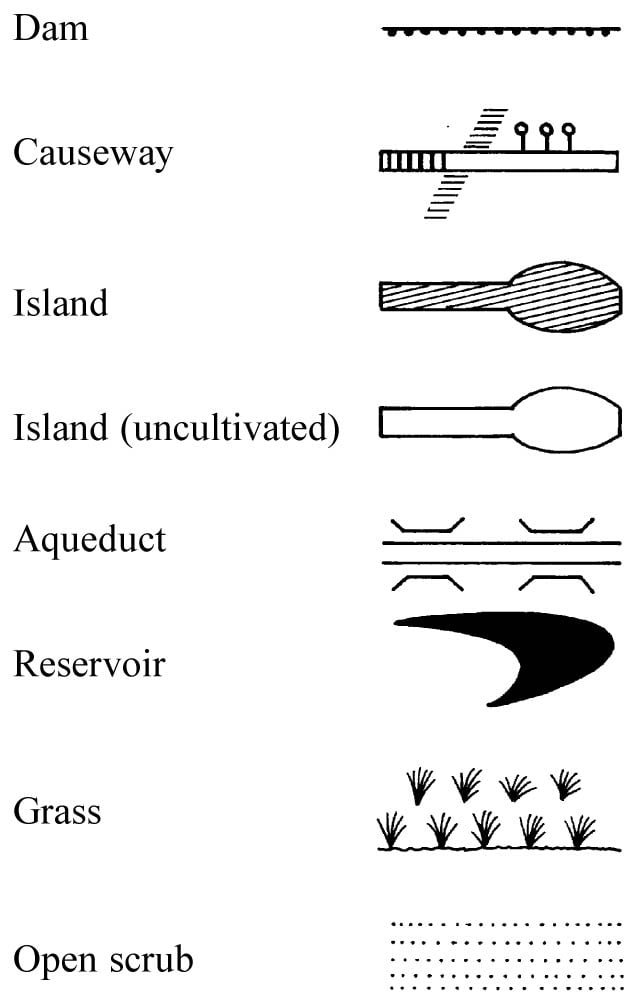
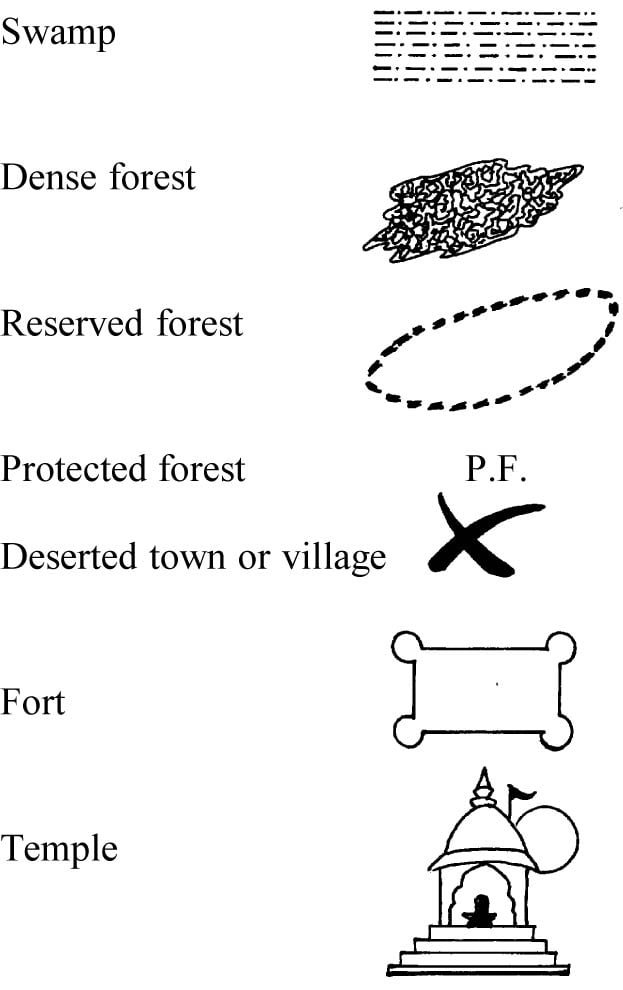
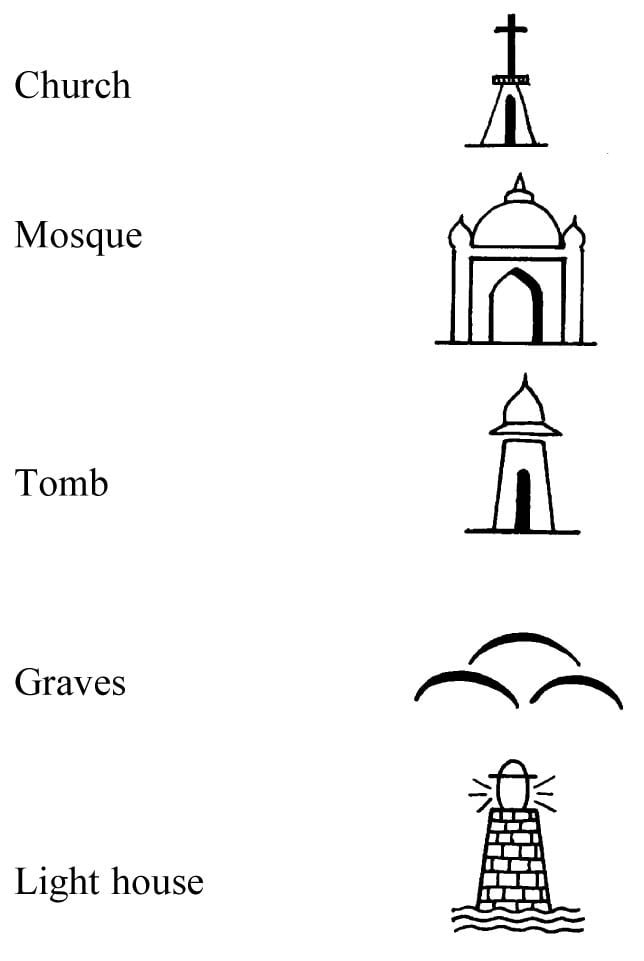
Some Conventional Signs Defined
Bridge with piers : It is an overhead structure supported by masonry pillars to or railway crossing.
Embankment : It is a structure of mud or stone and raised on the ground to keep the river flowing.
Broken Ground : It is found along the banks of a river in arid areas where the soil gets easily eroded due to heavy rain or weathering.
Aqueduct : It is a man made channel or pipeline built of masonry for carrying water. It is usually raised or elevated, i.e., a bridge carrying a canal.
Rock outcrop : The part of a rock formation on surface of the earth. It may be visible or masked by thin layers of soil or grass or scanty vegetation.
Fireline : It is a pith of 5 metres wide. It is made into the forest. It does not have any vegetation. It prevents the fire from spreading further because fire spreads from bush to bush.
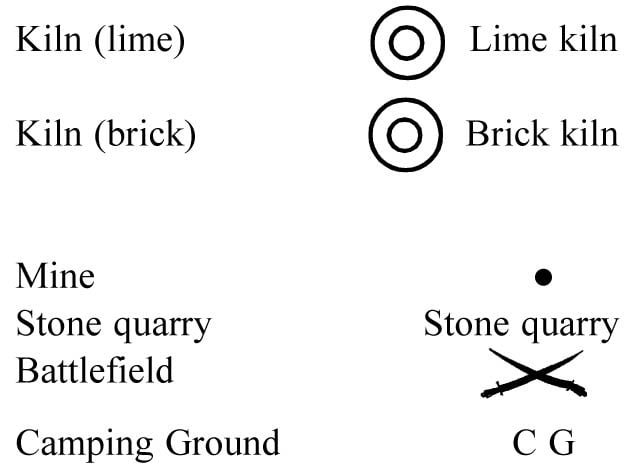
Kiln : It is for bricks drying and baking, pottery and limestone baking oven.
Sheet Rock : Sheet rock is a continuous stretch of horizontally embedded sedimentary rocks which are exposed to the surface.
Shelving : Shelving means a slopping structure, with reference to the bank of a river.
Stone quarry : It is an open place from where stone or slate is obtained by cutting or blasting for constructing buildings.
Salt pan : A depression which was earlier the bottom of the tank or lake and has become dry, leaving behind salt deposits due to evaporation.
Causaway : It is a raised masonry road across a minor stream.